


|
|

|
|
|
||
|
|
|
This is version 31.
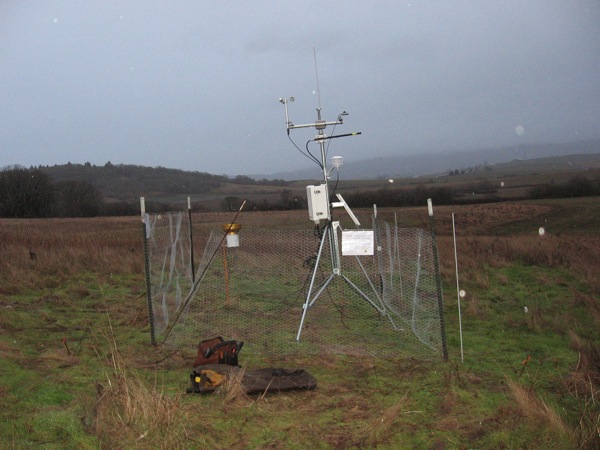
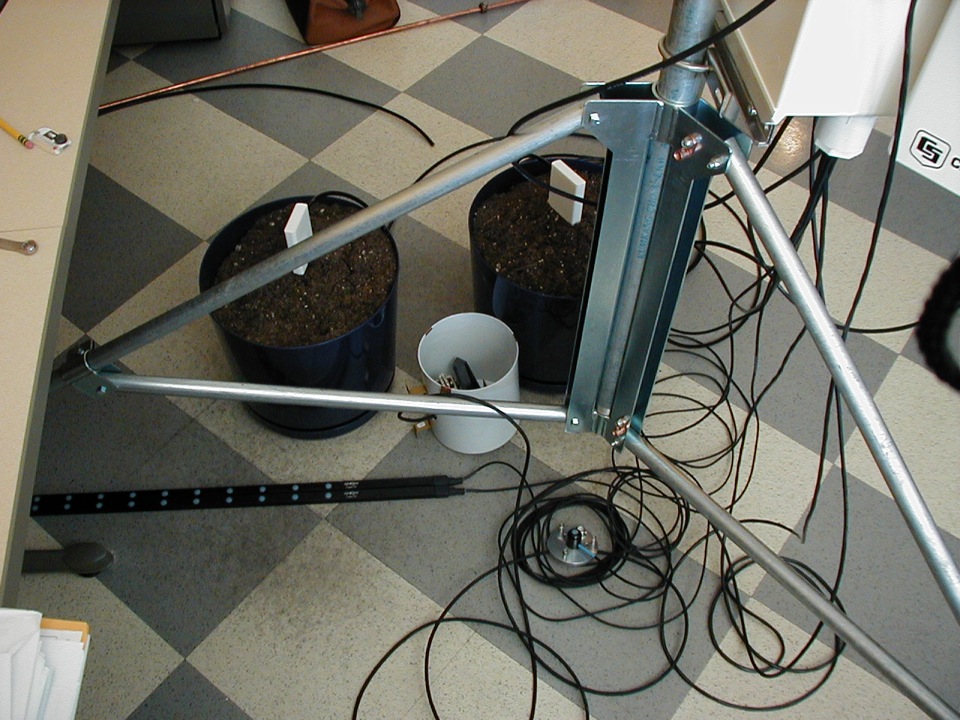
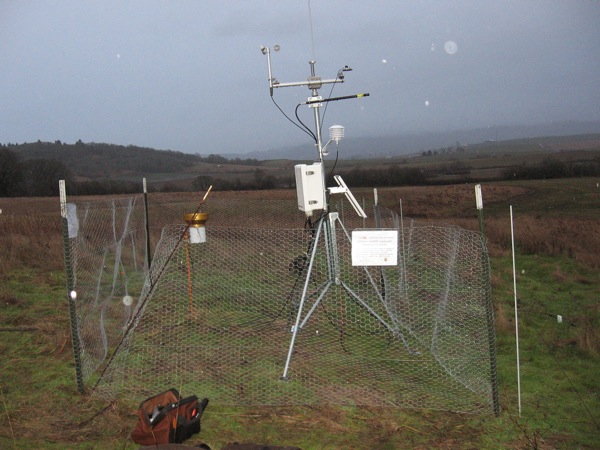
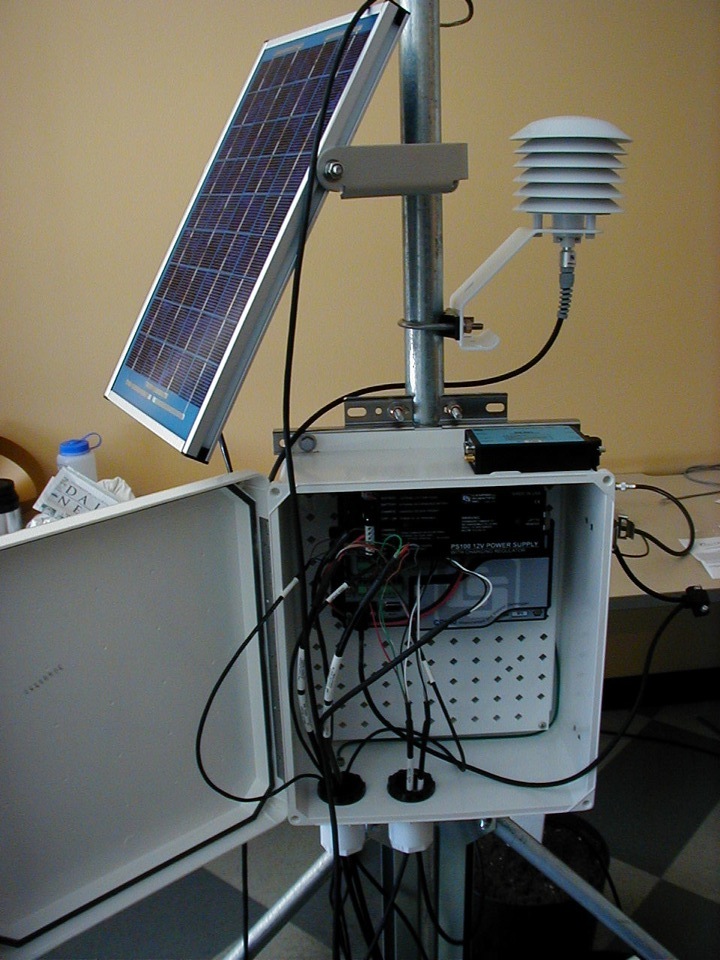
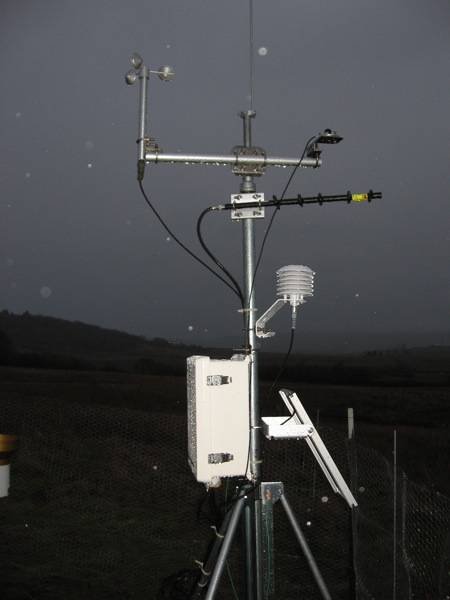
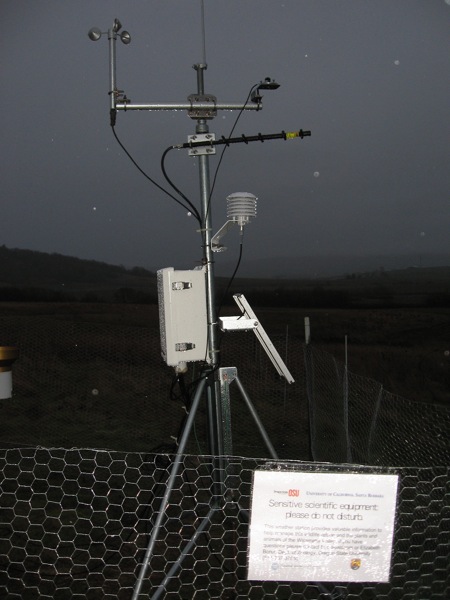
It is not the current version, and thus it cannot be edited. InfoBelow find details on the terrestrial usecase hardware, some pictures from a dry run setup, screenshots of an example Kepler workflow using the RBNBToKepler2 actor and the resulting plots. The CRBasic program used to collect these data is also posted below. hardware, some pictures from a dry run setup, screenshots of an example Kepler workflow using the RBNBToKepler2 actor and the resulting plots. The CRBasic program used to collect these data is also posted below.
Note: Don't try to read too much into these plots--data were collected indoors, from hardware that was occasionally moved about, powered off, etc. The program I use to push data into my RBNB server and the RBNBToKepler2 actor were both being modified as well.
HardwareFor sensors see further down the page.
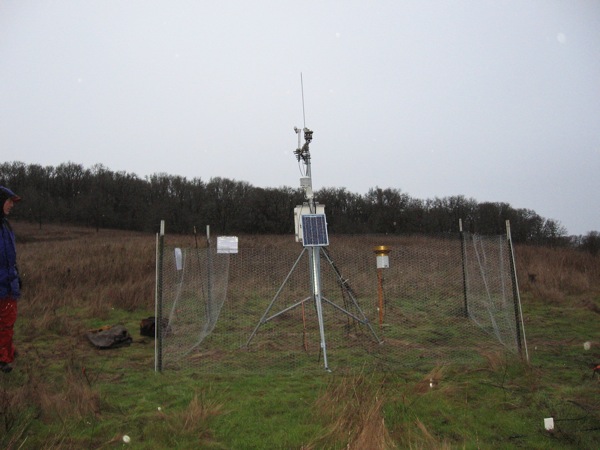
Pictures
WorkflowA bit messy...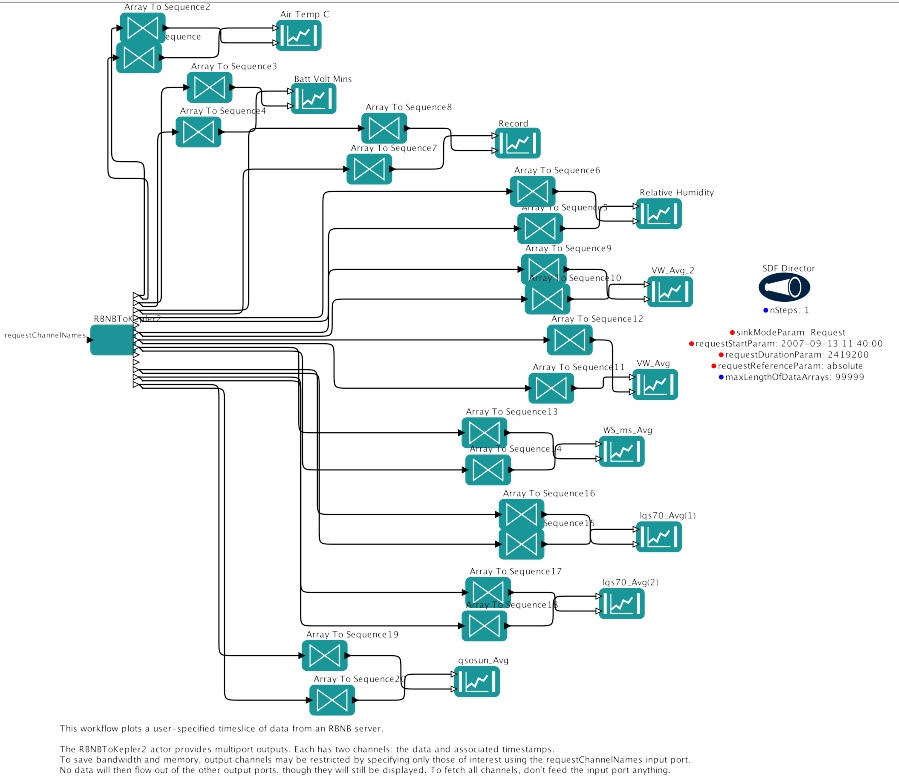
PlotsAll times are in seconds since unix epoch. This will be remedied in the future, it requires a fair amount of development to be implemented properly. You can easily see when I switched from AC to solar near the beginning of the battery voltage plot. Sensors and the solar panel were occasionally arbitrarily moved about. We had one cloudy day.
Air Temp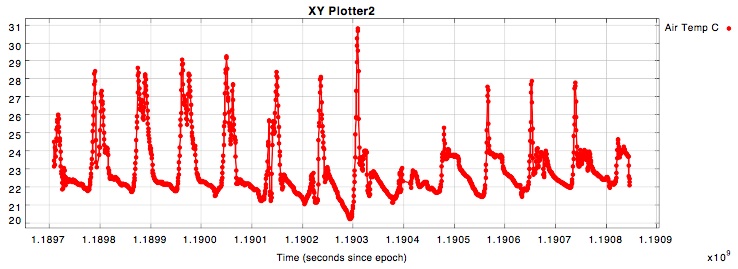
Relative Humidity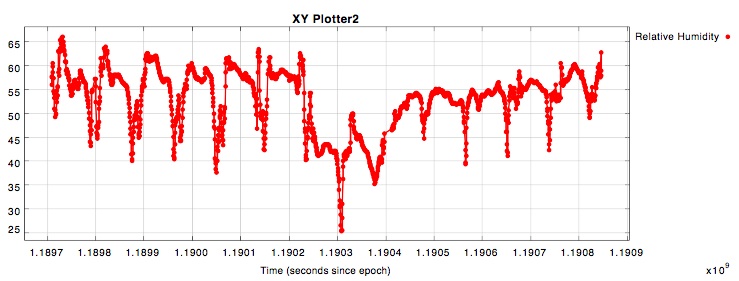
Battery Voltage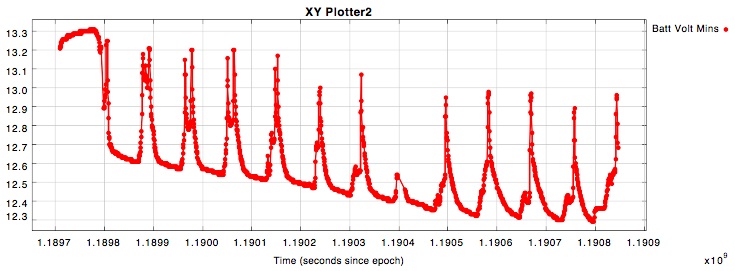
Line Photosynthetic Photon Flux (PPF) 1.jpg)
Line PPF 2.jpg)
Point PPF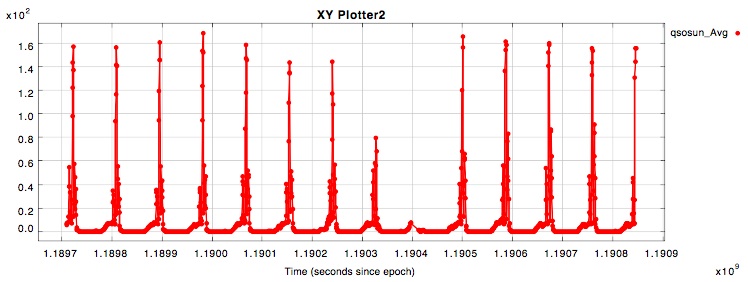
Records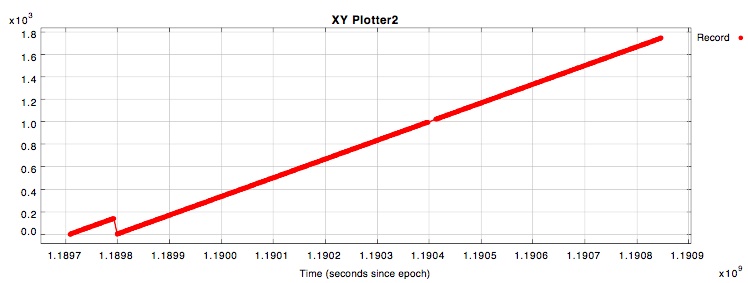
Wind Speed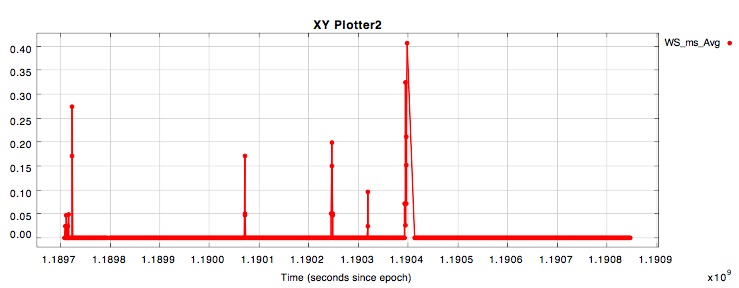
Volumetric Water Content (VWC) 1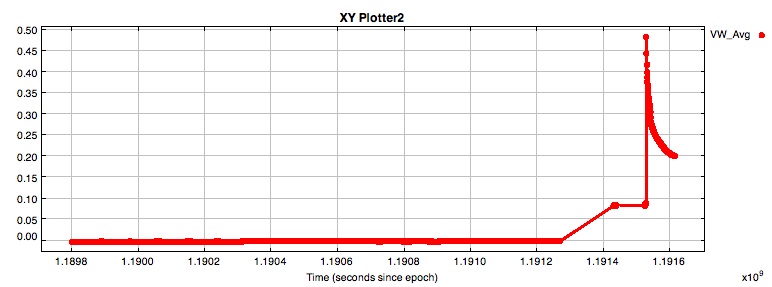
VWC 2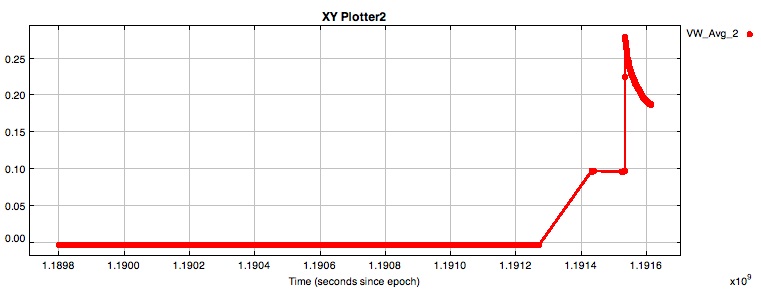
Rain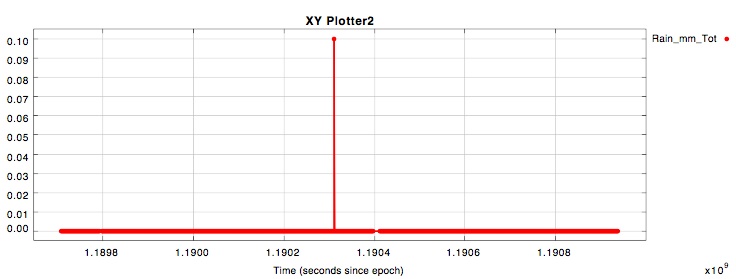
Datalogger programThis is the CRBasic program running on the CR800 doing the sampling.allSensors.CR8:
'CR800
'Created by Short Cut (2.5)
'
'Modified to fit my wiring. Also made other changes. Derik Barseghian 09.12.07
'ie WARNING: don't trust the wiring diagrams Shortcut shows when you open this prog

'Declare Variables and Units
Public Batt_Volt
Public VW
Public PA_uS
Public VW_2
Public PA_uS_2
Public lqs70(2)
Public qsosun
Public WS_ms
Public TRHData(2)
Public Rain_mm

Alias TRHData(1)=AirTC
Alias TRHData(2)=RH

Units Batt_Volt=Volts
Units PA_uS=uSec
Units PA_uS_2=uSec
Units lqs70=mV
Units qsosun=mV
Units WS_ms=meters/second
Units Rain_mm=mm
Units AirTC=Deg C
Units RH=%

'Define Data Tables
DataTable(Table1,True,-1)
        DataInterval(0,10,Min,10)
        Minimum(1,Batt_Volt,FP2,False,False)
        Average(1,VW,FP2,False)
        Average(1,VW_2,FP2,False)
        Average(1,lqs70(1),FP2,False)
        Average(1,lqs70(2),FP2,False)
        Average(1,qsosun,FP2,False)
        Average(1,WS_ms,FP2,False)
        Maximum(1,WS_ms,FP2,False,False)
        Minimum(1,WS_ms,FP2,False,False)
        Average(1,AirTC,FP2,False)
        Sample(1,RH,FP2)
        Totalize(1,Rain_mm,FP2,False)
EndTable

'Main Program
BeginProg
        Scan(30,Sec,1,0)
                'Default Datalogger Battery Voltage measurement Batt_Volt:
                Battery(Batt_Volt)
                'CS616 Water Content Reflectometer measurements VW and PA_uS:
                CS616(PA_uS,1,5,1,1,1,0)
                VW=-0.0663+(-0.0063*PA_uS)+(0.0007*PA_uS^2)
                'CS616 Water Content Reflectometer measurements VW_2 and PA_uS_2:
                CS616(PA_uS_2,1,6,2,1,1,0)
                VW_2=-0.0663+(-0.0063*PA_uS_2)+(0.0007*PA_uS_2^2)
                'Generic Single-Ended Voltage measurements lqs70(1):
                VoltSe(lqs70(1),2,mV2500,1,True,0,_60Hz,1.0,0.0)
                'Generic Single-Ended Voltage measurements qsosun:
                VoltSE(qsosun,1,mV2500,2,True,0,_60Hz,1.0,0.0)
                '014A Wind Speed Sensor measurement WS_ms:
                PulseCount(WS_ms,1,1,2,1,0.8,0.447)
                If WS_ms<0.457 Then WS_ms=0
                'CS215 Temperature & Relative Humidity Sensor (CSL) measurements AirTC and RH:
                SDI12Recorder(AirTC,3,"0","M!",1,0)
                'TE525MM/TE525M Rain Gauge measurement Rain_mm:
                PulseCount(Rain_mm,1,2,2,0,0.1,0)
                'Call Data Tables and Store Data
                CallTable(Table1)
        NextScan
EndProg
Wiring detailsThis is how I've currently got things wired.
ComputerDetails on the computer that will be deployed at Internet Point of Presence:Dell Optiplex gx270 p4 2.8ghz winXP Pro sp2 1gb 75gb ntfs (65gb free) Bios: Boot Sequence: 1. Floppy device (not installed) 2. IDE CD-ROM Device 3. Hard-Disk Drive C: 4. Integrated NIC PowerOn: On. Everyday at 00:00 Remote wake is On. AC Power Recovery: On Windows Auto logon has been enabled via tweakui LoggerNet is in Startup folder Windows Automatic Updates turned off. WIndows firewall is on. dyndns updater running as a service (ask me for address) tightvnc server running with "Allow only loopback connections" set. ie you must ssh tunnel. starts automatically on login
Todo:
Attachments:
|
| This material is based upon work supported by the National Science Foundation under award 0619060. Any opinions, findings and conclusions or recomendations expressed in this material are those of the author(s) and do not necessarily reflect the views of the National Science Foundation (NSF). Copyright 2007 |


