|
!! Conceptual Description of REAP SST Usecase
The goal of the REAP SST usecase workflow (REAP-SST-UCW) is to compare and match-up existing remote-sensed (satellite) images of sea surface temperature found in OPeNDAP archives.
- User Input:
The workflow starts by getting input from the user. These inputs decide how to subset the available SST datasets.
- The datasets to use: For now, we assume only 2D fields, either satellite or model output (MODIS, HYCOM, etc.). Furthermore, all 2D fields in a given data set will be in the same geographic project; such data sets are referred to as Level 3 data sets$$. "The Level 3 mapped products are global gridded data sets with all points filled, even over land." Ref

- Timespan: Beginning and end timestamps.
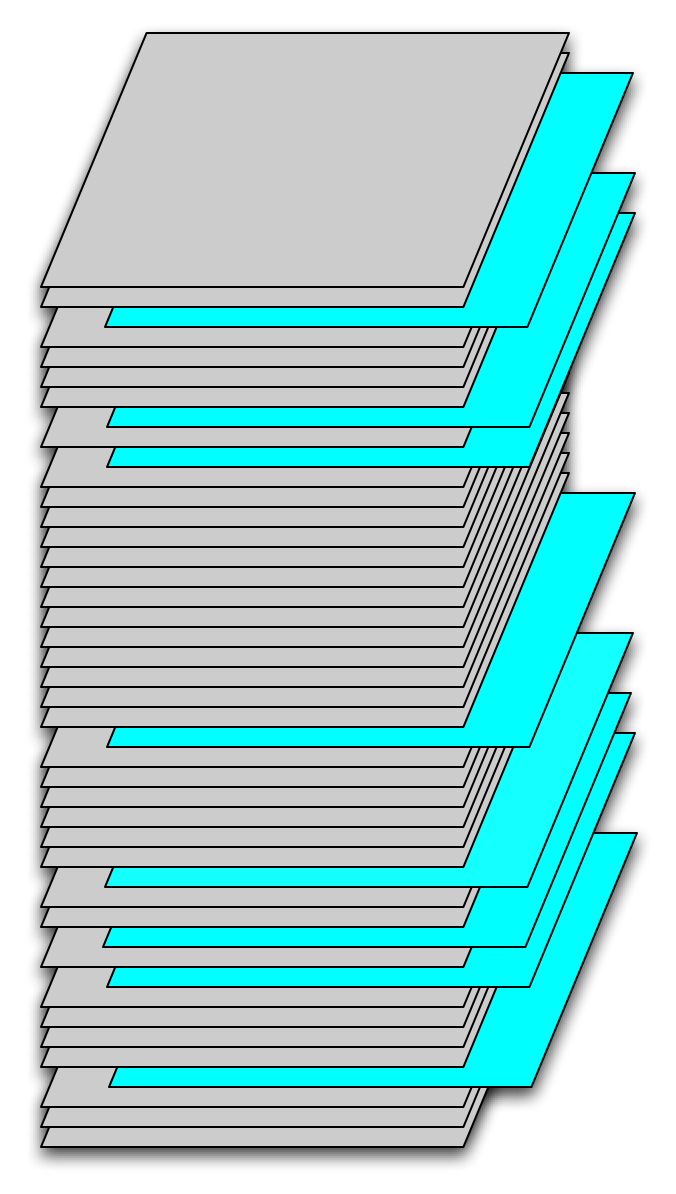
- Time sampling: Percentage of the dataset times within the timespan. This parameter defines the fraction of temporal fields in the selected subset of the dataset to be sampled. Sampling will be random based on this fraction. Figure 1 is a schematic of a data set, with each gray field corresponding to a latitude, longitude array at one instant in time. The blue slices correspond to fields randomly sampled from the time series. In this case the temporal sampling parameter was approximately 20%.
Figure 1. Temporal samples from a time series of SST fields.
 |
- Time span delta: Maximum amount of time between a reference dataset time sample and the corresponding sample of another dataset (see Step 2.4)
Not sure what you are referring to here?
- Maximum and minimum latitudes: Latitude ranges for the spatial region
- Maximum and minimum longitudes: Longitude ranges for the spatial region
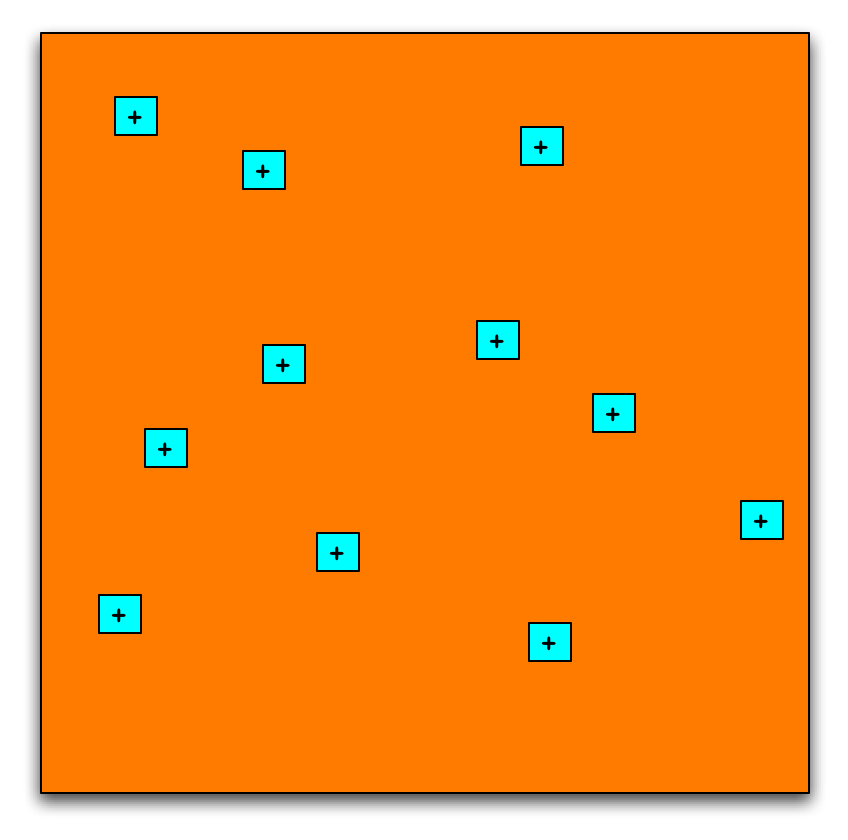
- Percentage Spatial sampling: Percentage of the area defined by the min/max latitudes and longitudes to sample. To better understand this, we define tile. A tile is a rectangular region that includes a set of pixels. A pixel is an atomic area and is characterized by an SST value at a lat,long that represents the center of a pixel. The percentage of the area sampled is determined by the number of tiles per field times the number of pixels per tile divided by the total number of pixels in the defined subregion. Spatial sampling is performed on individual 2-d fields. Figure 2 shows the selection of a temporal sample that is to be sampled spatially. Figure 3 shows the randomly selected spatial samples, tiles, with the area covered by each.
Figure 2. Selection of a temporal sample.
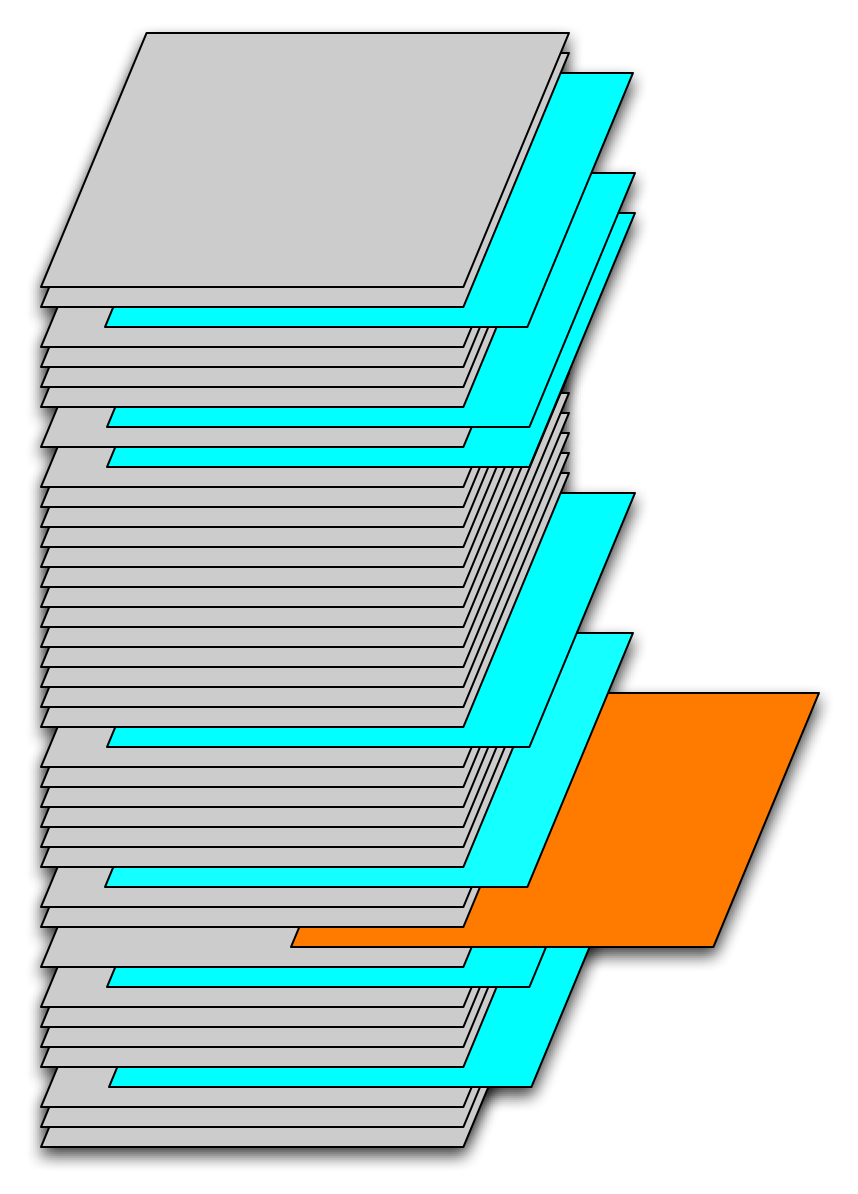 |
Figure 3. Spatial samples in this temporal sample.
 |
- MinNumberOfPixels: This parameter is the minimum number of pixels in each spatial sample. For example if the minimum number of pixels is 9, the sampled area will consist of 3x3 pixels centered on the randomly selected spatial location. In the comparison of several data sets, the number of pixels per sample varies from dataset to dataset. The minimum number in the coarsest dataset defines the spatial region of each sample. This region is then used in the other data sets to define the number of pixels to sample sample from them. The percentage of area sampled in each data set will be approximately the same, although the number of pixels will differ.
- Spatial window delta: Maximum amount of overlap between a reference dataset and the corresponding region of another dataset
We need the ppt figure from Peter C.<<I don't think that I have a ppt for this one. As I recall, this came up in our discussion of the search procedure. We want to find all datasets that overlap a reference dataset by some amount. If the data sets just touch, then they the new one is not of a lot of interest. This is the stuff that was on the whiteboard right?
- Sampling This defines the method to use when matching sample locations from one data set to another. We should start with 'Nearest Neighbor' and 'Bi-linear Interpolation'.
We might just start with Nearest Neighbor'. Can add more later.
- TileAveraging: The tiles from different datasets will consist of different numbers of pixels determined by the relative resolution of each data set. Comparing the tile values requires some form of averaging. This parameter defines how the averaging is to be done. For now let's fix this at a straight linear average.
- Build Match-Up Datasets:
Once the user has input parameters in step 1, the workflow builds a set of tiles or match-ups. The match-up building starts with finding the coarsest granularity of timesteps depending on the metadata for the datasets. The dataset is sampled and closest timeframe of the other datasets is determined based on this coarsest dataset.
For each timestep, the workflow finds the dataset with coarsest spatial granularity. Then the workflow randomly chooses spatial samples or tiles of this reference dataset. These are bounded by the min. and max. latitudes and longitudes. The spatial samples are randomly selected such that they cover the spatial percentage of the reference dataset.
For each spatial sample selected in the previous step, the workflow determines the corresponding sample area in each of the other datasets. The SST values for the spatial samples are retrieved for each dataset. A description of the samples retrieved is written to a database. For each sample, the description including latitude,longitude center and descriptions of the sample for each dataset (Timeframe, Array of latitudes, Array of longitudes, SST values, Number of good SST values, Sum of SST values).
- Analyze Match-Up Datasets:
The selected and saved (in an RDBMS) SST match-up dataset values can then be used in statistical comparisons. To be defined in detail after the implementation of the first two steps.
Attachments:
|


